<< Back to Home
< Back to Brazil in Graphs
Brazil in a nutshell
Services
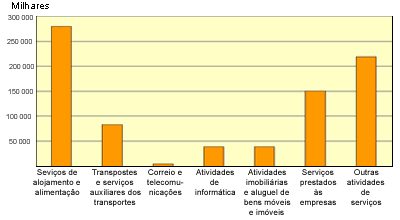
Number of enterprises by sector

|
The bars represent these sectors: Food and Lodgding; Transportation; Postal and Telecommunications; Technology; Real Estate; Services to other companies; Other services.
The figures represent the total number of establishments, without regard to their sizes, revenues, etc. For example, there are few telecommunication companies in Brazil, but their participation in revenue is very relevant.
|
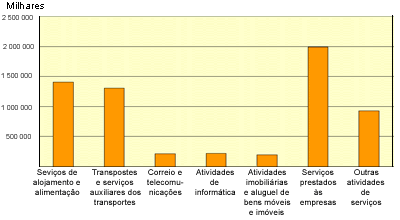
Employees by sector

|
Same key legends as the previous graph.
A large proportion of employees of the sector service work for other companies, instead of working for consumers.
|
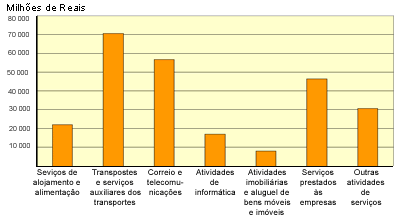
Revenues by sector

|
Same key legends as the previous graph.
Figures in millions or Reais. Figures represent revenue, not profits (the transportation sector has the largest revenue, but probably the largest associated expenses).
|
Total salaries paid

|
Same key legends as the previous graph.
Figures in millions of Reais.
|
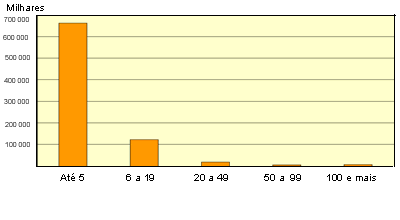
Size of enterprizes, by number of employees

|
The massive majority of services companies employs up to 5 employees. A very small percentage employs more than 100 employees.
|
Back to Top
|

